Multiple Choice
Use the bar graph.
The bar graph shows the number of tornado reports each decade since the 1950s
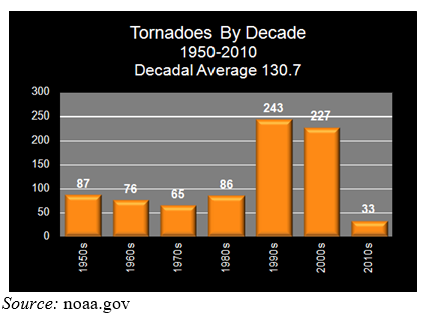
-Use roster notation to represent the correspondence between the decade (the input) and the number of tornado reportings (the output) .
A) 
B) 
C) 
D) 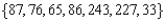
E) none of these
Correct Answer:

Verified
Correct Answer:
Verified
Q56: Use the table that shows the relationship
Q57: Using <img src="https://d2lvgg3v3hfg70.cloudfront.net/TB10230/.jpg" alt="Using notation,
Q58: The function <img src="https://d2lvgg3v3hfg70.cloudfront.net/TB10230/.jpg" alt="The function
Q59: Use the quadratic function n <img src="https://d2lvgg3v3hfg70.cloudfront.net/TB10230/.jpg"
Q60: Use the graph of the function <img
Q62: Which of the equations or inequalities represents
Q63: Change the function <img src="https://d2lvgg3v3hfg70.cloudfront.net/TB10230/.jpg" alt="Change the
Q64: A function is <img src="https://d2lvgg3v3hfg70.cloudfront.net/TB10230/.jpg" alt="A function
Q65: Use a table of values to graph
Q66: Use a table of ordered pairs to