Multiple Choice
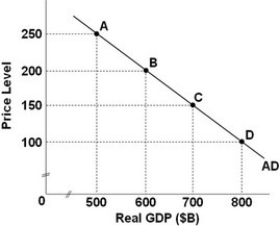
- Refer to the above graph, which shows an aggregate demand curve for a hypothetical economy. If the price level is 150, the quantity of real GDP demanded is:
A) $500 billion.
B) $600 billion.
C) $700 billion.
D) $800 billion.
Correct Answer:

Verified
Correct Answer:
Verified
Q9: If Congress raised taxes on businesses, this
Q10: An aggregate supply curve shows the:<br>A) level
Q11: An increase in aggregate supply increases the
Q12: <img src="https://d2lvgg3v3hfg70.cloudfront.net/TB9951/.jpg" alt=" Refer to the
Q13: Major increases in oil prices in the
Q15: Other things being equal, a reorganization of
Q16: <img src="https://d2lvgg3v3hfg70.cloudfront.net/TB9951/.jpg" alt=" -Refer to
Q17: The ratchet effect means that:<br>A) when aggregate
Q18: Aggregate demand is a schedule that shows
Q19: An increase in net exports reduces aggregate