Multiple Choice
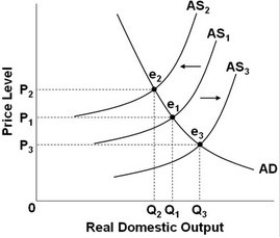
-Refer to the above diagram. Cost-push inflation can be illustrated by a:
A) shift in the aggregate supply curve from AS1 to AS2.
B) shift in the aggregate supply curve from AS1 to AS3.
C) shift in the aggregate supply curve from AS2 to AS3.
D) movement along the aggregate demand curve from e1 to e3.
Correct Answer:

Verified
Correct Answer:
Verified
Q11: An increase in aggregate supply increases the
Q12: <img src="https://d2lvgg3v3hfg70.cloudfront.net/TB9951/.jpg" alt=" Refer to the
Q13: Major increases in oil prices in the
Q14: <img src="https://d2lvgg3v3hfg70.cloudfront.net/TB9951/.jpg" alt=" - Refer to
Q15: Other things being equal, a reorganization of
Q17: The ratchet effect means that:<br>A) when aggregate
Q18: Aggregate demand is a schedule that shows
Q19: An increase in net exports reduces aggregate
Q20: Which of the following will lead to
Q21: <img src="https://d2lvgg3v3hfg70.cloudfront.net/TB9951/.jpg" alt=" - Refer to