Essay
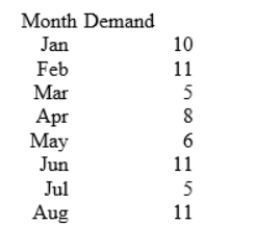
The table below shows the demand for Fidgets (they're like Widgets, only they're more active) over an eight month period. Calculate a four-period moving average forecast for September. Also evaluate the quality of the four-period moving average forecasting model by calculating the root mean square error for the data set. Note: round all intermediate calculations to two decimal places.
Correct Answer:

Verified
 Forecast for September: (6 + ...
View Answer
Unlock this answer now
Get Access to more Verified Answers free of charge
Correct Answer:
Verified
View Answer
Unlock this answer now
Get Access to more Verified Answers free of charge
Q1: The table below shows semi-annual demand (in
Q2: A firm has determined that its average
Q3: Regression analysis was used to estimate the
Q4: Regression analysis was used to estimate the
Q6: One advantage of the Delphi method is
Q7: The use of an estimated demand equation
Q8: The use of leading indicators to forecast
Q9: Forecasts based on leading indicators are qualitative.
Q10: The table below shows semi-annual demand (in
Q11: The ratio-to-trend method is used to estimate