Essay
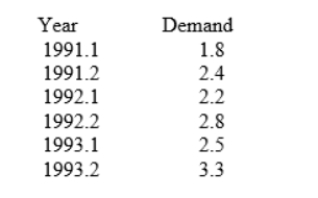
The table below shows semi-annual demand (in 1,000s) for Didgets (they're like Widgets, only they're easier to work). A linear trend has been estimated using this data set with t = 1 for 1991.1 and t = 6 for 1993.2. It has an intercept of 1.66 and a slope of 0.24. Use the ratio-to-trend method to calculate seasonal adjustment factors for the first and second half of the year and then forecast the level of demand for 1996.1 and 1996.2. Note: round all intermediate calculations to two decimal places.
Correct Answer:

Verified
Correct Answer:
Verified
Q2: A firm has determined that its average
Q3: Regression analysis was used to estimate the
Q4: Regression analysis was used to estimate the
Q5: The table below shows the demand for
Q6: One advantage of the Delphi method is
Q7: The use of an estimated demand equation
Q8: The use of leading indicators to forecast
Q9: Forecasts based on leading indicators are qualitative.
Q10: The table below shows semi-annual demand (in
Q11: The ratio-to-trend method is used to estimate