Multiple Choice
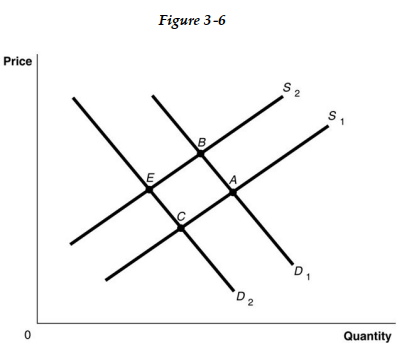
-Refer to Figure 3-6. The graph in this figure illustrates an initial competitive equilibrium in the market for apples at the intersection of D1 and S1 (point A) . If there is an increase in the wages of apple workers and an increase in the price of oranges, a substitute for apples, the equilibrium could move to which point?
A) E
B) B
C) None of the points shown.
D) C
Correct Answer:

Verified
Correct Answer:
Verified
Q9: <img src="https://d2lvgg3v3hfg70.cloudfront.net/TB9865/.jpg" alt=" -Refer to Figure
Q10: Research suggests that supermarkets should consider which
Q11: New technology developed in 1999 resulted in
Q12: <img src="https://d2lvgg3v3hfg70.cloudfront.net/TB9865/.jpg" alt=" -Refer to Figure
Q13: According to the Australian Wool Innovation, severe
Q15: <img src="https://d2lvgg3v3hfg70.cloudfront.net/TB9865/.jpg" alt=" -Refer to Figure
Q16: Fluctuations in the prices of oil are
Q17: Mazin subscribes to a monthly pest control
Q18: What is the difference between an "increase
Q19: Even when the demand for one good