Short Answer
Two processes are shown on the p-V graph in Figure 12-1; one is an adiabat and the other is an isotherm. Is the process represented by the upper curve an adiabat or an isotherm?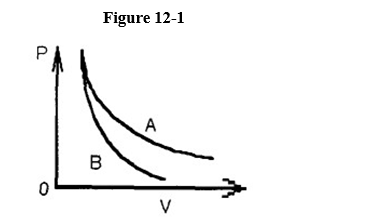
Correct Answer:

Verified
Correct Answer:
Verified
Related Questions
Q18: The Otto cycle has how many strokes
Q19: The work done by the gas is
Q20: The Department of Energy develops a new
Q21: A gas is confined to a rigid
Q22: Referring to Figure 12-9, a substance carried
Q24: An example of a reversible process is
Q25: Why don't we use "efficiency" for rating
Q26: The change of the internal energy of
Q27: One of the most efficient engines built
Q28: A Carnot cycle requires an ideal gas