Multiple Choice
Solve the problem.
-Data regarding the amount spent by a government department is represented in the following graph. Find the slope of the line by using any two of the points shown on the line. Is the slope equal to the yearly change in amount spent?
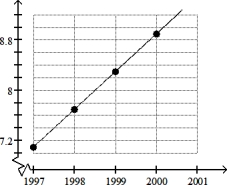
Year
A) Slope: $0.15 billion; no
B) Slope: $0.6 billion; yes
C) Slope: $0.35 billion; yes
D) Slope: $0.25 billion; no
Correct Answer:

Verified
Correct Answer:
Verified
Q280: Graph the linear equation.<br>--7x + y =
Q281: Provide an appropriate response.<br> <br>-What were the
Q282: Choose the line that most closely resembles
Q283: Graph the linear inequality<br>-y < -2<br><img src="https://d2lvgg3v3hfg70.cloudfront.net/TB9570/.jpg"
Q284: Evaluate the function.<br>-Given f(x) = 5x <sup>2
Q286: Graph the line through the given point
Q287: Find the intercepts for the graph of
Q288: Solve the problem.<br>-Suppose that during a certain
Q289: Solve the problem.<br>-The graph shows the sales
Q290: Decide whether the equation defines y as