Multiple Choice
Solve the problem.
-The graph shows the sales of a particular brand of appliance from 1992 to 2010, where 1992 corresponds to x = 0. Two of the data points in the graph can be represented by the ordered pairs (0, 600) and (10, 2000) . Use these ordered pairs to write an equation of a line that models the data. Give the equation in slope- intercept form.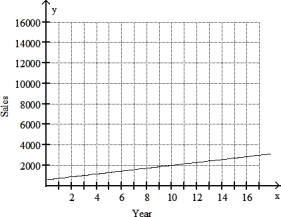
A) y = 60x + 2000
B) y = 140x + 600
C) y = 140x + 2000
D) y = 60 + 600
Correct Answer:

Verified
Correct Answer:
Verified
Q284: Evaluate the function.<br>-Given f(x) = 5x <sup>2
Q285: Solve the problem.<br>-Data regarding the amount spent
Q286: Graph the line through the given point
Q287: Find the intercepts for the graph of
Q288: Solve the problem.<br>-Suppose that during a certain
Q290: Decide whether the equation defines y as
Q291: State whether the graph is or is
Q292: Solve the problem.<br>-This chart shows the number
Q293: Use the geometric interpretation of slope (rise
Q294: The table shown was generated by a