menu-iconExamlexExamLexServices

Discover

Ask a Question
  1. All Topics
  2. Topic
    Mathematics
  3. Study Set
    Beginning Algebra
  4. Exam
    Exam 4: Systems of Linear Equations and Inequalities
  5. Question
    The Table Shown Was Generated by a Graphics Calculator
Solved

The Table Shown Was Generated by a Graphics Calculator

Question 86

Question 86

Multiple Choice

The table shown was generated by a graphics calculator. The expression y1 represents f(x) .
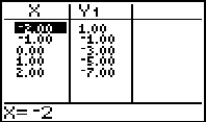
-The table shown was generated by a graphics calculator. The expression y<sub>1 </sub>represents f(x) . -  What is f(1) ? A)  0 B)  - 2 C)  - 5 D)  Not shown
What is f(1) ?


A) 0
B) - 2
C) - 5
D) Not shown The table shown was generated by a graphics calculator. The expression y<sub>1 </sub>represents f(x) . -  What is f(1) ? A)  0 B)  - 2 C)  - 5 D)  Not shown

Correct Answer:

verifed

Verified

Unlock this answer now
Get Access to more Verified Answers free of charge

Related Questions

Q81: Graph the linear equation. Give the x-

Q82: Find an equation in slope-intercept form of

Q83: Give the ordered pairs for the points

Q84: Write an equation of the line through

Q85: Solve the problem.<br>-The graph shows the sales

Q87: Plot the ordered pairs on the rectangular

Q88: Provide the proper response.<br>-If two nonvertical lines

Q89: Find the domain and range of the

Q90: Find the slope of the line.<br>-y =

Q91: Complete the ordered pair for the given

Examlex

ExamLex

About UsContact UsPerks CenterHomeschoolingTest Prep

Work With Us

Campus RepresentativeInfluencers

Links

FaqPricingChrome Extension

Download The App

Get App StoreGet Google Play

Policies

Privacy PolicyTerms of ServiceHonor CodeCommunity Guidelines

Scan To Download

qr-code

Copyright © (2025) ExamLex LLC.

Privacy PolicyTerms Of ServiceHonor CodeCommunity Guidelines