Multiple Choice
Solve the problem.
-The graph shows the sales of a particular brand of appliance from 1992 to 2010, where 1992 corresponds to x = 0. Is the slope of the line in the graph positive or negative? Explain.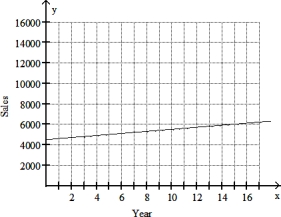
A) Positive; The sales are increasing.
B) Negative; The sales are decreasing. 
Correct Answer:

Verified
Correct Answer:
Verified
Q80: Solve.<br>-Use the vertical line test to determine
Q81: Graph the linear equation. Give the x-
Q82: Find an equation in slope-intercept form of
Q83: Give the ordered pairs for the points
Q84: Write an equation of the line through
Q86: The table shown was generated by a
Q87: Plot the ordered pairs on the rectangular
Q88: Provide the proper response.<br>-If two nonvertical lines
Q89: Find the domain and range of the
Q90: Find the slope of the line.<br>-y =