Multiple Choice
The figure below shows the cost curves of a firm in a competitive market. The firm always makes the choice to maximize its profit.
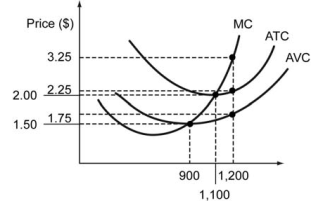
-Refer to the figure above. If the market price of the product is $3.25, the firm's profit maximizing output is ________ and the firm's maximum profit is ________.
A) 1,200 units; $1,200
B) 1,200 units; $1,800
C) 1,100 units; $875
D) 1,100 units; $600
Correct Answer:

Verified
Correct Answer:
Verified
Q11: The income per capita in a country
Q12: Two economies, A and B, have identical
Q13: A car repair shop hires workers and
Q14: The price of a standard basket of
Q15: Country X has 1,000 workers. The countryʹs
Q17: The following figure shows the cost curves
Q18: The figure below shows the marginal cost
Q19: In Lutheria, there are 10,000 people in
Q20: What is Moore?s Law?
Q21: The total number of workers in two