Multiple Choice
The following figure shows the cost curves on a firm that operates in a competitive market. Assume that all the firms in this market have identical cost structure.
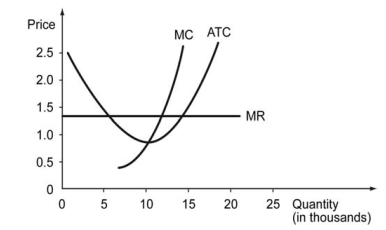
-Refer to the graph above. Which of the following graphs correctly represents this competitive market's demand and supply in the short run?
A) 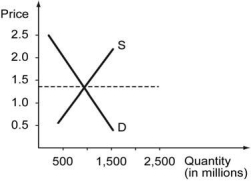
B) 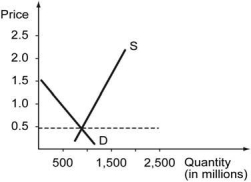
C) 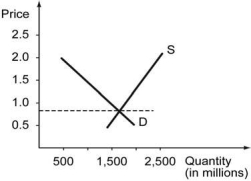
D) 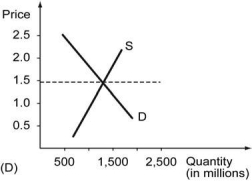
Correct Answer:

Verified
Correct Answer:
Verified
Q12: Two economies, A and B, have identical
Q13: A car repair shop hires workers and
Q14: The price of a standard basket of
Q15: Country X has 1,000 workers. The countryʹs
Q16: The figure below shows the cost curves
Q18: The figure below shows the marginal cost
Q19: In Lutheria, there are 10,000 people in
Q20: What is Moore?s Law?
Q21: The total number of workers in two
Q22: The figure below shows the marginal cost