Multiple Choice
The diagram below shows the demand curve, supply curve, and the marginal social cost curve for a manufacturing unit.
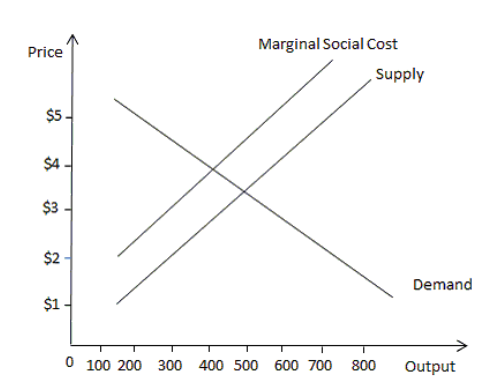
-Refer to the scenario above. If the government imposes a tax of _______,output will ______.
A) $1; fall below the socially optimal level
B) $2; rise above the socially optimal level
C) $2.50; fall below the socially optimal level
D) $4.50; rise above the competitive level
Correct Answer:

Verified
Correct Answer:
Verified
Q56: What is ?carbon capture?? Is it a
Q57: The figure below shows the demand, supply
Q58: Which of the following is true of
Q59: To an economist,_<br>A) each good is priceless<br>B)
Q60: The figure below shows the marginal pollution
Q62: The figure below shows the marginal pollution
Q63: The figure below shows the marginal pollution
Q64: The figure below shows the marginal pollution
Q65: The figure below shows the marginal pollution
Q66: Why should economists study climate change?