Multiple Choice
The figure below shows the marginal pollution abatement cost curves of two firms- Company X and Company Y.
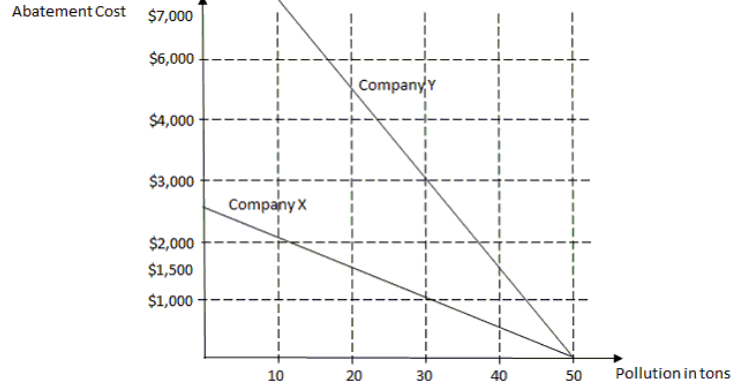
-Refer to the figure above. If the government sets a pollution cap of 30 tons of emission per firm, Company X will incur an abatement cost of ________.
A) $1,000
B) $1,500
C) $2,500
D) $3,000
Correct Answer:

Verified
Correct Answer:
Verified
Q58: Which of the following is true of
Q59: To an economist,_<br>A) each good is priceless<br>B)
Q60: The figure below shows the marginal pollution
Q61: The diagram below shows the demand curve,
Q62: The figure below shows the marginal pollution
Q63: The figure below shows the marginal pollution
Q64: The figure below shows the marginal pollution
Q66: Why should economists study climate change?
Q67: The figure below shows the marginal pollution
Q68: Which of the following is true of