Multiple Choice
Use the graph below, which shows changes during the menstrual cycle, to answer the following Questions
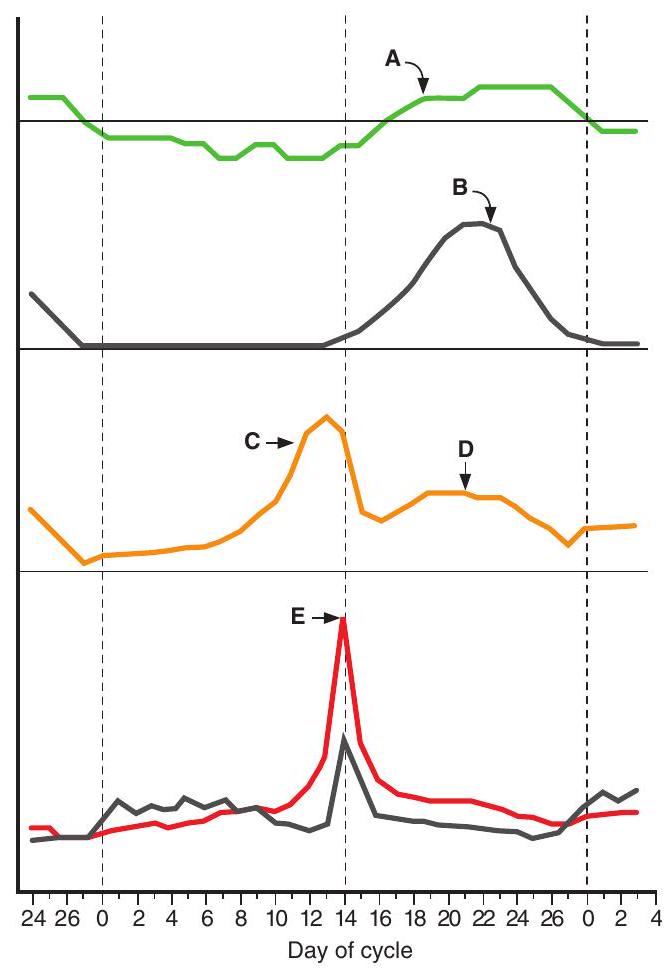
-The source of the increase in concentration at point is the
A) ovary
B) adrenal cortex
C) corpus luteum
D) hypothalamus
E) anterior pituitary
Correct Answer:

Verified
Correct Answer:
Verified
Related Questions
Q21: A 46-year-old woman has hirsutism, hyperglycemia, obesity,
Q22: Blood levels of which of the
Q23: Use the graph below, which shows
Q24: Which of the following would be
Q25: Which of the following substances is derived
Q27: Which of the following decreases the
Q28: Increased adrenocorticotropic hormone (ACTH) secretion would be
Q29: Use the graph below, which shows
Q30: Which of the following pancreatic secretions has
Q31: A 38-year-old man who has galactorrhea is