Multiple Choice
Use the graph below, which shows changes during the menstrual cycle, to answer the following Questions
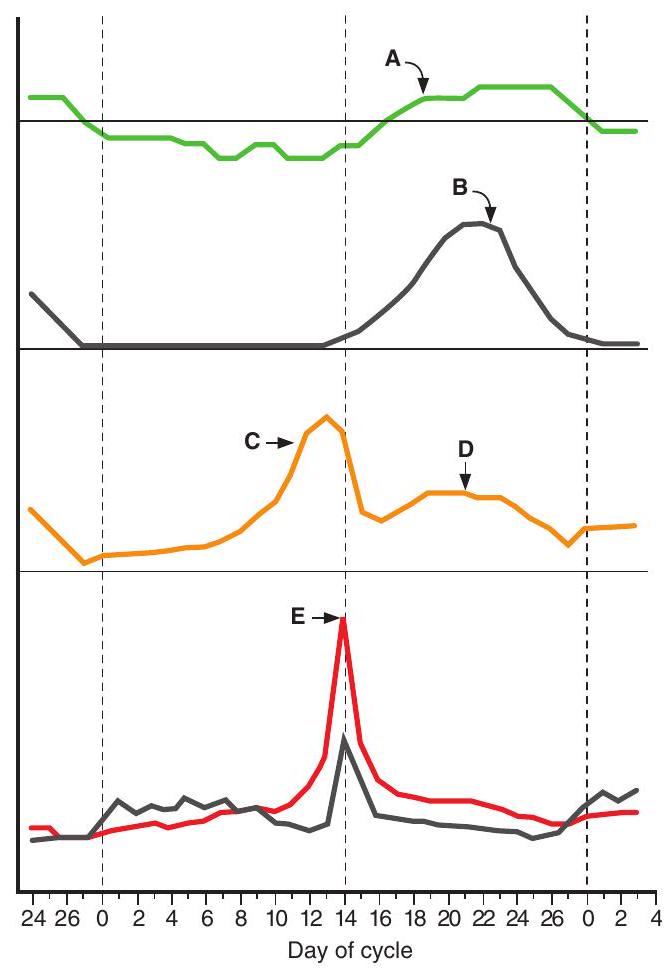
-The cause of the sudden increase shown at point is
A) negative feedback of progesterone on the hypothalamus
B) negative feedback of estrogen on the anterior pituitary
C) negative feedback of follicle-stimulating hormone (FSH) on the ovary
D) positive feedback of FSH on the ovary
E) positive feedback of estrogen on the anterior pituitary
Correct Answer:

Verified
Correct Answer:
Verified
Q18: A 16-year-old, seemingly normal female is
Q19: Selective destruction of the zona glomerulosa of
Q20: Which of the following explains the suppression
Q21: A 46-year-old woman has hirsutism, hyperglycemia, obesity,
Q22: Blood levels of which of the
Q24: Which of the following would be
Q25: Which of the following substances is derived
Q26: Use the graph below, which shows
Q27: Which of the following decreases the
Q28: Increased adrenocorticotropic hormone (ACTH) secretion would be