Essay
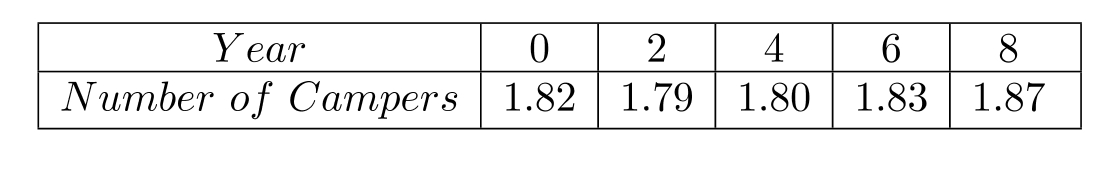
The minimum yearly temperature in a certain temperate climate was recorded each year for five years beginning
in 2000. The minimum temperature increased for the first few years before declining. The table shows the temperature, in degrees Fahrenheit, for those years, with 2000 represented by year 0, 2001 by year 1, and so on. Use the data points , and to find a quadratic function defined by that models the data. Graph together with the data.
Correct Answer:

Verified
Correct Answer:
Verified
Q7: Evaluate each determinant.<br>(a) <span class="ql-formula"
Q8: Evaluate each determinant.<br>(a) <span class="ql-formula"
Q9: Solve the system by using Cramer's
Q10: Find the partial fraction decomposition for
Q11: Consider the system of equations<br> <span
Q13: Perform the following matrix operations if
Q14: Consider the system of equations<br> <span
Q15: The employment rate in a city
Q16: Perform the following matrix operations if
Q17: Perform the following matrix operations if