Essay
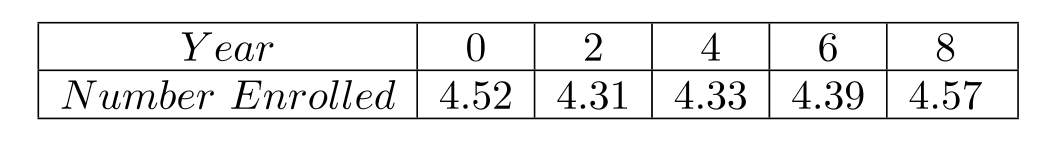
The employment rate in a city has been documented at two year intervals. The table shows the number of employed citizens, in millions, tor several years, with 2000 represented by year 0,2002 by year 2 , and so on. Use the data points , and to find a quadratic function defined by that models the data. Graph together with the data.
Correct Answer:

Verified
Correct Answer:
Verified
Q10: Find the partial fraction decomposition for
Q11: Consider the system of equations<br> <span
Q12: The minimum yearly temperature in a
Q13: Perform the following matrix operations if
Q14: Consider the system of equations<br> <span
Q16: Perform the following matrix operations if
Q17: Perform the following matrix operations if
Q18: Consider the system of equations<br> <span
Q19: Solve the system by using Cramer's
Q20: Suppose that <span class="ql-formula" data-value="A"><span