Multiple Choice
Use the following to answer the questions below:
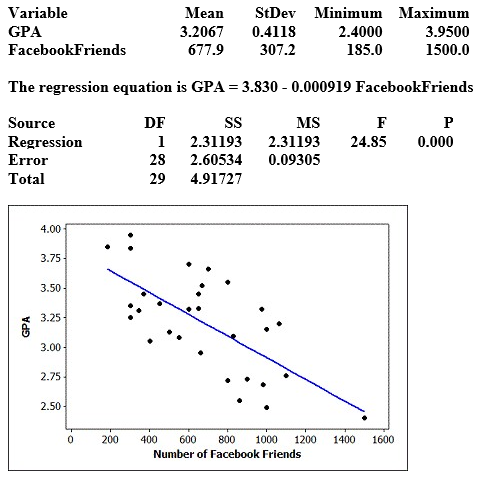
Data were collected on GPA and number of Facebook friends for students in a small statistics class. Some summary statistics, partial output from the regression analysis, and a scatterplot of the data (with regression line) are provided. Assume that students in this class are typical of all students at the university.
Use three decimal places when reporting the results from any calculations, unless otherwise specified.
-Compute the t test statistic for the slope.
A) -4.989
B) -5.022
C) -5.465
D) - 5.479
Correct Answer:

Verified
Correct Answer:
Verified
Q27: Use the following to answer the questions
Q28: Use the following to answer the questions
Q29: Use the following to answer the questions
Q30: The website for the Quantitative Environmental Learning
Q31: Use the following to answer the questions
Q33: Use the following to answer the questions
Q34: Use the following to answer the questions
Q35: In a random sample of 41 students,
Q36: Is there evidence of a negative correlation
Q37: Use the following to answer the questions