Multiple Choice
Use the following to answer the questions below:
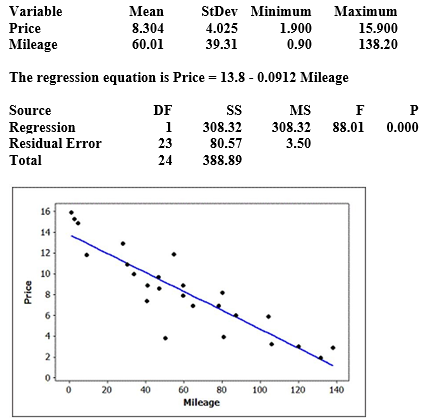
Data were collected on the mileage (in thousands of miles) and price (in thousands of dollars) of a random sample of used Hyundai Elantras. A scatterplot of the data (with regression line) , some summary statistics, and partial computer output from a regression analysis are provided.
Use three decimal places when reporting the results from any calculations, unless otherwise specified.
-Use the following computer output to identify and interpret a 95% interval for the price of a single used Hyundai Elantra with 70,000 miles. 
A) We are 95% sure that the price of a single used Hyundai Elantra with 70,000 miles is between $3,440 and $11,347.
B) We are 95% sure that the mean price of all used Hyundai Elantras with 70,000 miles is between $3,440 and $11,347.
C) We are 95% sure that the price of a single used Hyundai Elantra with 70,000 miles is between $6,593 and $8,193.
D) We are 95% sure that the mean price of all used Hyundai Elantras with 70,000 miles is between $6,593 and $8,193.
Correct Answer:

Verified
Correct Answer:
Verified
Q29: Use the following to answer the questions
Q30: The website for the Quantitative Environmental Learning
Q31: Use the following to answer the questions
Q32: Use the following to answer the questions
Q33: Use the following to answer the questions
Q35: In a random sample of 41 students,
Q36: Is there evidence of a negative correlation
Q37: Use the following to answer the questions
Q38: Use the following to answer the questions
Q39: Use the following to answer the questions