Essay
Use the following to answer the questions below:
Data were collected on the mileage (in thousands of miles) and price (in thousands of dollars) of a random sample of used Hyundai Elantras. A scatterplot of the data (with regression line), some summary statistics, and partial computer output from a regression analysis are provided.
Use three decimal places when reporting the results from any calculations, unless otherwise specified.
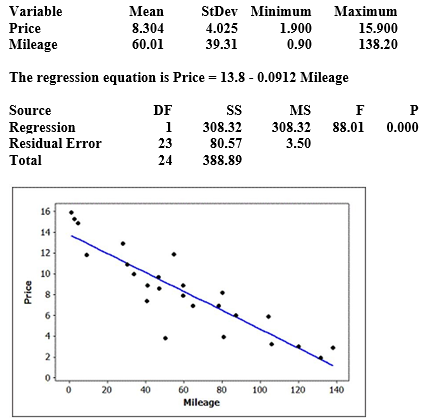
-Use the provided output to construct and interpret a 95% interval for the mean price of all used Hyundai Elantras with 50,000 miles.
Correct Answer:

Verified
df = 23 so t* = 2.069
9.24 ± 2.069 ∙ 1.8...View Answer
Unlock this answer now
Get Access to more Verified Answers free of charge
Correct Answer:
Verified
9.24 ± 2.069 ∙ 1.8...
View Answer
Unlock this answer now
Get Access to more Verified Answers free of charge
Q44: Use the information in the ANOVA table
Q45: Use the following to answer the questions
Q46: Use the following to answer the questions
Q47: Use the following to answer the questions
Q48: Use the following to answer the questions
Q50: Use the following to answer the questions
Q51: Use the following to answer the questions
Q52: What is the estimated slope in this
Q53: Compute the t test statistic for the
Q54: Use the following to answer the questions