Multiple Choice
Use the following to answer the questions below:
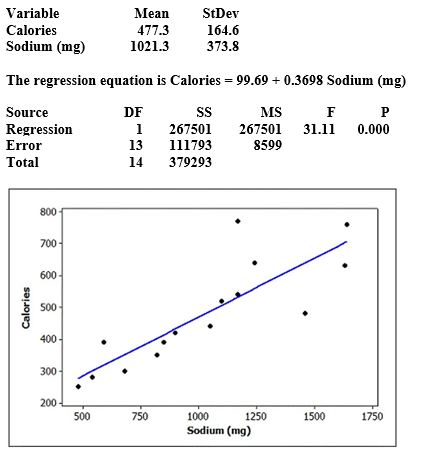
Fast food restaurants are been required to publish nutrition information about the foods they serve. Nutrition information about a random sample of McDonald's lunch/dinner menu items (excluding sides and drinks) was obtained from their website. We wish to use the sodium content (in milligrams) to better understand the number of calories in the lunch/dinner menu items at McDonald's. Some summary statistics, partial computer output from a regression analysis, and a scatterplot (with regression line) of the data are provided.
Use two decimal places when reporting the results from any calculations, unless otherwise
-Use the provided output to compute and interpret  .
.
A)  = 0.71
71% of the variability in the number of calories in McDonald's lunch/dinner menu items in the sample is explained by the sodium content (mg) .
B)  = 0.71
71% of the variability in the sodium content (mg) in McDonald's lunch/dinner menu items in the sample is explained by the number of calories.
C)  = 0.42
42% of the variability in the number of calories in McDonald's lunch/dinner menu items in the sample is explained by the sodium content (mg) .
D)  = 0.42
42% of the variability in the sodium content (mg) in McDonald's lunch/dinner menu items in the sample is explained by the number of calories.
Correct Answer:

Verified
Correct Answer:
Verified
Q41: Use the following to answer the questions
Q42: Use the following to answer the questions
Q43: Use the following to answer the questions
Q44: Use the information in the ANOVA table
Q45: Use the following to answer the questions
Q47: Use the following to answer the questions
Q48: Use the following to answer the questions
Q49: Use the following to answer the questions
Q50: Use the following to answer the questions
Q51: Use the following to answer the questions