Multiple Choice
Which of the following graphs is mostly likely to represent the resale price of a car which depreciates steadily until it is worthless?
A) 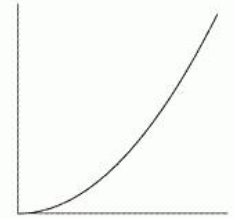
B) 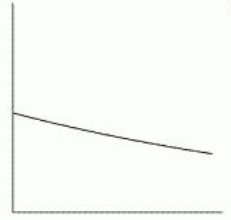
C) 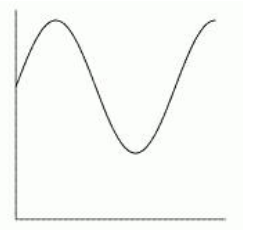
D) 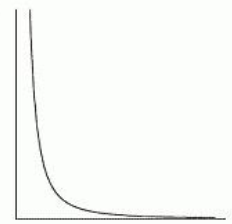
E) 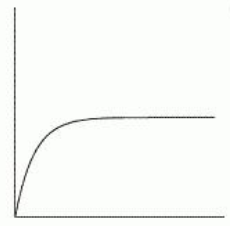
F) 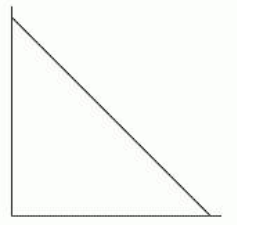
Correct Answer:

Verified
Correct Answer:
Verified
Q78: Line <span class="ql-formula" data-value="\mathrm{A}"><span class="katex"><span
Q79: If <span class="ql-formula" data-value="f(2)>f(3.2)"><span class="katex"><span
Q80: At a price of <span
Q81: <span class="ql-formula" data-value="y=7+7 x"><span class="katex"><span class="katex-mathml"><math xmlns="http://www.w3.org/1998/Math/MathML"><semantics><mrow><mi>y</mi><mo>=</mo><mn>7</mn><mo>+</mo><mn>7</mn><mi>x</mi></mrow><annotation
Q82: The following figure shows the graph
Q84: Let <span class="ql-formula" data-value="f(t)"><span class="katex"><span
Q85: The following table shows the height
Q86: The following table shows the relationship
Q87: You have <span class="ql-formula" data-value="\$
Q88: Several years ago, the wild rabbits