Short Answer
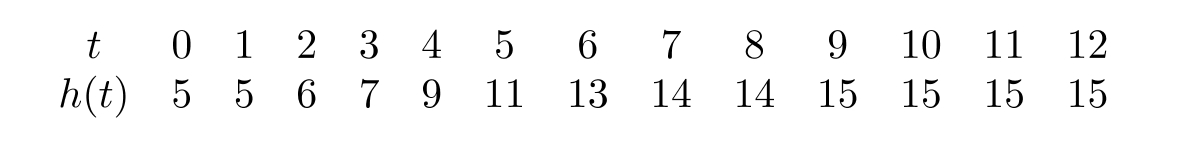
The following table shows the height of a tree (to the nearest foot) as a function of time (in years). What was the average rate of change in the height of the tree between and ?
Correct Answer:

Verified
Correct Answer:
Verified
Q80: At a price of <span
Q81: <span class="ql-formula" data-value="y=7+7 x"><span class="katex"><span class="katex-mathml"><math xmlns="http://www.w3.org/1998/Math/MathML"><semantics><mrow><mi>y</mi><mo>=</mo><mn>7</mn><mo>+</mo><mn>7</mn><mi>x</mi></mrow><annotation
Q82: The following figure shows the graph
Q83: Which of the following graphs is mostly
Q84: Let <span class="ql-formula" data-value="f(t)"><span class="katex"><span
Q86: The following table shows the relationship
Q87: You have <span class="ql-formula" data-value="\$
Q88: Several years ago, the wild rabbits
Q89: At a price of <span
Q90: Determine the point of intersection of the