True/False
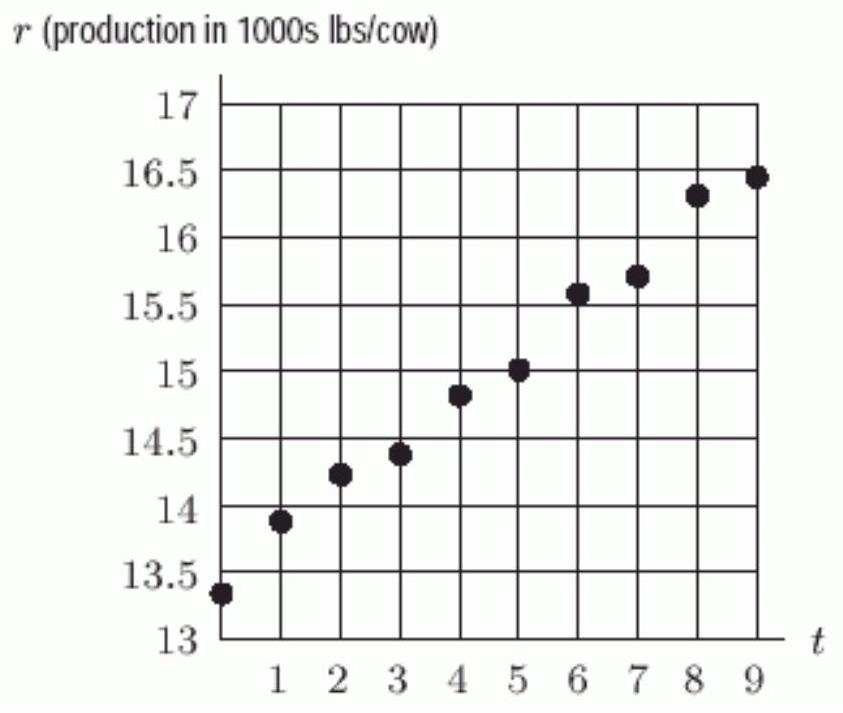
The following figure gives the annual amount of milk produced (in 1000s of pounds) per US milk cow as a function of , the number of years since 1986. Is the regression line reasonably correct?
Correct Answer:

Verified
Correct Answer:
Verified
Related Questions
Q17: The following figure show the distance of
Q18: At a price of <span
Q19: Mark all of the following functions
Q20: For the line <span class="ql-formula"
Q21: Rewrite the equation in slope-intercept form.<br>
Q23: A certain baseball card's value is
Q24: Let <span class="ql-formula" data-value="f(x)=x^{2}"><span class="katex"><span
Q25: An athlete wanting to strengthen his
Q26: The distance traveled by a car
Q27: Find the vertical intercept of the