Short Answer
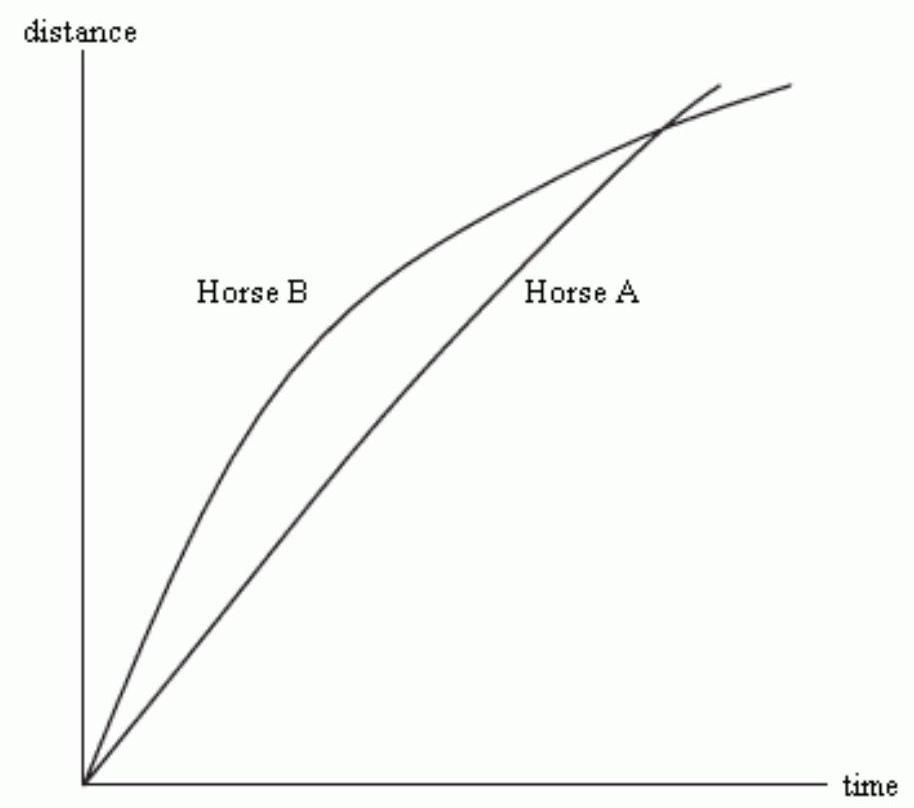
The following figure show the distance of two horses from the starting point of a race as a function of time. Which horse was ahead for most of the race? (Answer "A" or "B")
Correct Answer:

Verified
Correct Answer:
Verified
Related Questions
Q12: A cookie store has a fixed
Q13: Which of the following figures shows
Q14: Suppose there are 100 people living in
Q15: What could the following graph reasonably
Q16: If <span class="ql-formula" data-value="f(x)"><span class="katex"><span
Q18: At a price of <span
Q19: Mark all of the following functions
Q20: For the line <span class="ql-formula"
Q21: Rewrite the equation in slope-intercept form.<br>
Q22: The following figure gives the annual