Short Answer
The data points for the following table are graphed in the figures below.
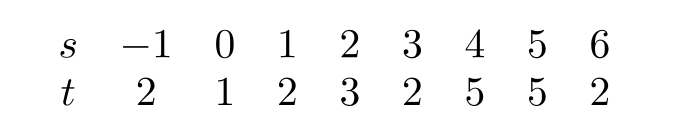
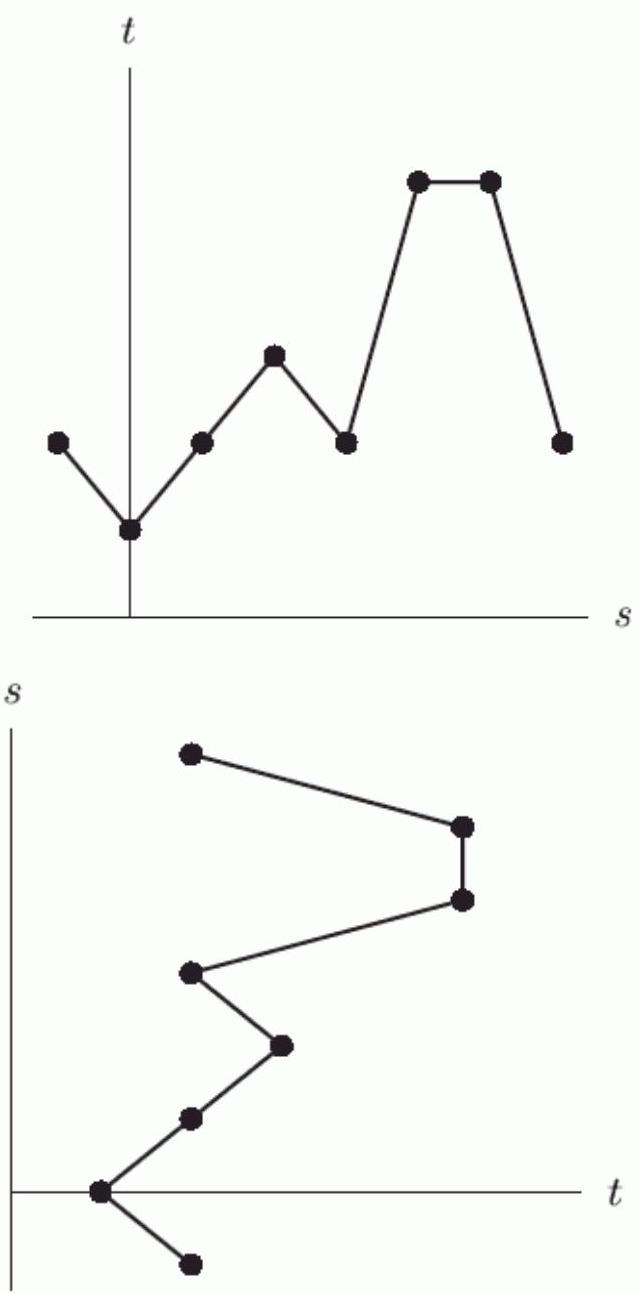
For the graph that is a function, we could write -----------=f(----------------), where is ------------ the dependent variable and ----------------- is the independent variable. (Fill in each blank with an or a " ").
Correct Answer:

Verified
Part A: 
P...View Answer
Unlock this answer now
Get Access to more Verified Answers free of charge
Correct Answer:
Verified
P...
View Answer
Unlock this answer now
Get Access to more Verified Answers free of charge
Q125: The number of bacteria in a sample
Q126: Let <span class="ql-formula" data-value="f(x)=\frac{7}{(x-3)^{2}}"><span class="katex"><span
Q127: If <span class="ql-formula" data-value="f(x)"><span class="katex"><span
Q128: Use the table below to answer
Q129: Given the function <span class="ql-formula"
Q131: If <span class="ql-formula" data-value="y=f(x)=x^{7}+6"><span class="katex"><span
Q132: The data points for the following
Q133: The function <span class="ql-formula" data-value="D(p)=1200-200
Q134: If <span class="ql-formula" data-value="f"><span class="katex"><span
Q135: Let <span class="ql-formula" data-value="I(x)"><span class="katex"><span