Short Answer
The data points for the following table are graphed in the figure below.
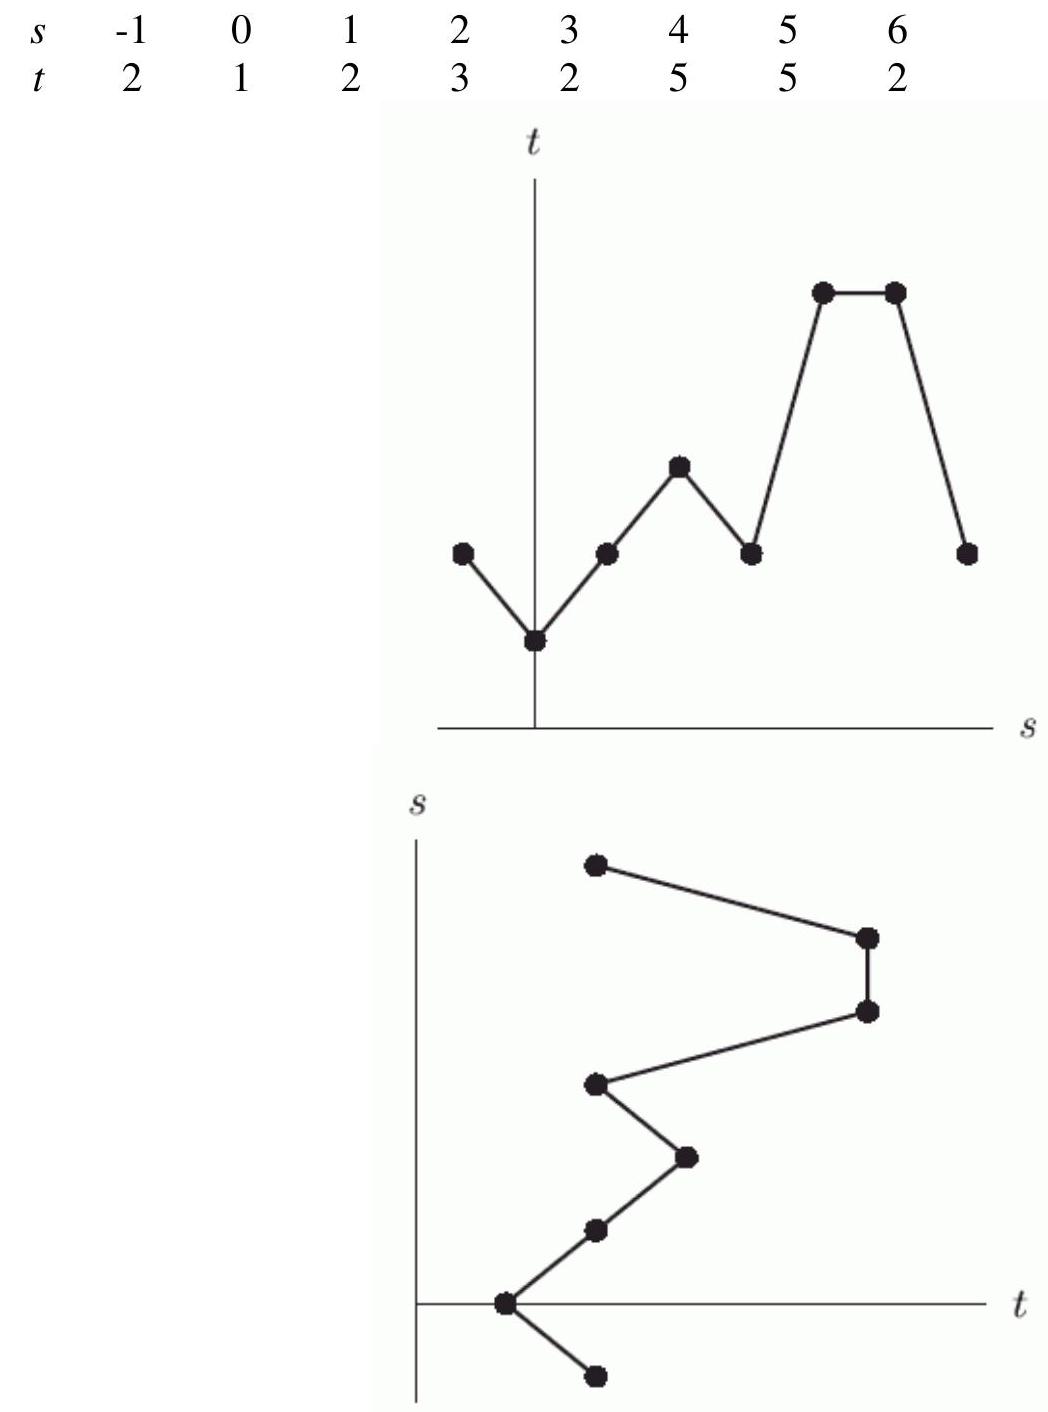
For the graph that is a function, approximate .
Correct Answer:

Verified
Correct Answer:
Verified
Q127: If <span class="ql-formula" data-value="f(x)"><span class="katex"><span
Q128: Use the table below to answer
Q129: Given the function <span class="ql-formula"
Q130: The data points for the following
Q131: If <span class="ql-formula" data-value="y=f(x)=x^{7}+6"><span class="katex"><span
Q133: The function <span class="ql-formula" data-value="D(p)=1200-200
Q134: If <span class="ql-formula" data-value="f"><span class="katex"><span
Q135: Let <span class="ql-formula" data-value="I(x)"><span class="katex"><span
Q136: Use the following table to evaluate
Q137: Let <span class="ql-formula" data-value="y=p(x)"><span class="katex"><span