Use the Following Chart Containing Values Of To Determine Whether the Function Appears to Be:
A) Increasing
Short Answer
Use the following chart containing values of to determine whether the function appears to be:
a) increasing or decreasing
b) concave up or concave down
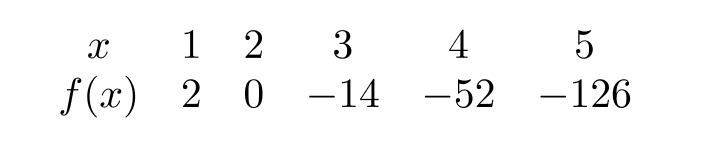
Correct Answer:

Verified
a) decreas...View Answer
Unlock this answer now
Get Access to more Verified Answers free of charge
Correct Answer:
Verified
View Answer
Unlock this answer now
Get Access to more Verified Answers free of charge
Q95: Sketch a graph of <span
Q96: Calculate successive rates of change for
Q97: Use the graph of <span
Q98: For <span class="ql-formula" data-value="f(x)=x^{2}-8 x+5"><span
Q99: Let<img src="https://d2lvgg3v3hfg70.cloudfront.net/TBW1046/.jpg" alt=" Let
Q101: Assuming the entire graph of
Q102: For <span class="ql-formula" data-value="f(x)=x^{2}-4 x+5"><span
Q103: Evaluate <span class="ql-formula" data-value="h(0)"><span class="katex"><span
Q104: Given the function <span class="ql-formula"
Q105: Use the following figure to evaluate