Solved
Calculate Successive Rates of Change for the Function Shown in the Following Table to Determine If the Graph
Multiple Choice
Calculate successive rates of change for the function shown in the following table to determine if the graph is more likely concave up or concave down for .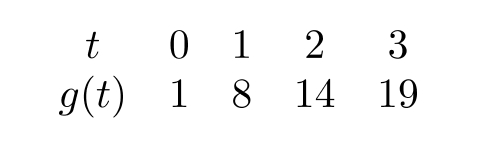
A) concave down
B) concave up
C) neither
Correct Answer:

Verified
Correct Answer:
Verified
Related Questions
Q91: Suppose <span class="ql-formula" data-value="f(x)=2(x-3)"><span class="katex"><span
Q92: ComGas, the Cambridge power company, charges
Q93: Which of the following is the
Q94: Does the following figure appear to be
Q95: Sketch a graph of <span
Q97: Use the graph of <span
Q98: For <span class="ql-formula" data-value="f(x)=x^{2}-8 x+5"><span
Q99: Let<img src="https://d2lvgg3v3hfg70.cloudfront.net/TBW1046/.jpg" alt=" Let
Q100: Use the following chart containing values
Q101: Assuming the entire graph of