Multiple Choice
The graph below shows the quantity of a drug in a patient's bloodstream over a period of time , in minutes.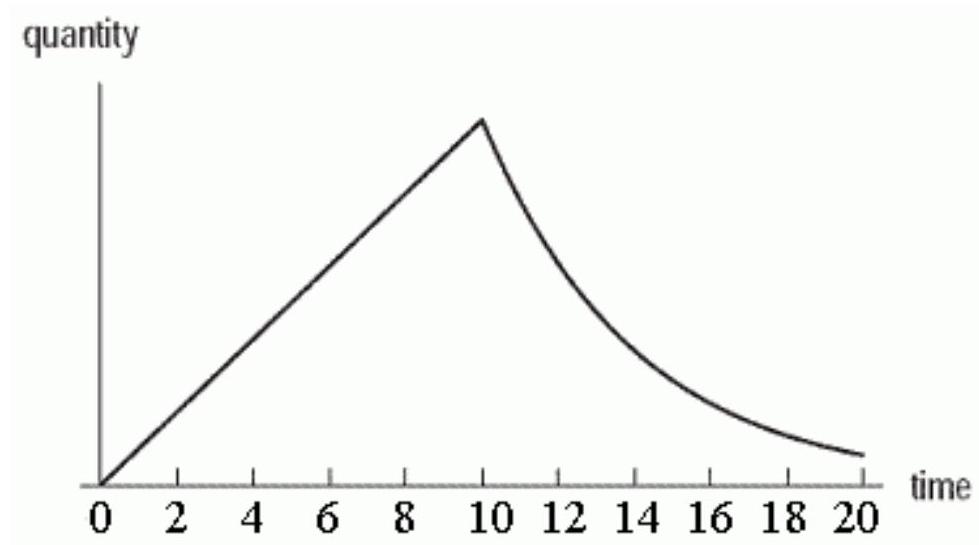
Which of the following scenarios best describes the graph?
A) The drug is injected over a 10 minute interval, during which the quantity increases linearly. After the 10 minutes, the injection is discontinued and the quantity then decays exponentially.
B) The drug is injected over a 10 minute interval, during which the quantity increases exponentially. After the 10 minutes, the injection is discontinued and the quantity then decays linearly.
C) The drug is injected all at once. The quantity first increases and then decreases linearly.
D) The drug is injected all at once. The quantity first increases and then decreases exponentially.
Correct Answer:

Verified
Correct Answer:
Verified
Q29: The populations of 4 species of
Q30: In the following figure, the functions
Q31: The following table gives values from
Q32: Is the function graphed exponential?<br> <img src="https://d2lvgg3v3hfg70.cloudfront.net/TBW1046/.jpg"
Q33: Find <span class="ql-formula" data-value="\lim _{t
Q35: In 2006, the cost of a
Q36: The price of an item increases
Q37: Let <span class="ql-formula" data-value="f(x)"><span class="katex"><span
Q38: Write the formula for the price
Q39: A biologist measures the amount of