Short Answer
Each of the functions in the table below is increasing, but each increases in a different way. One is linear, one is exponential, and one is neither.
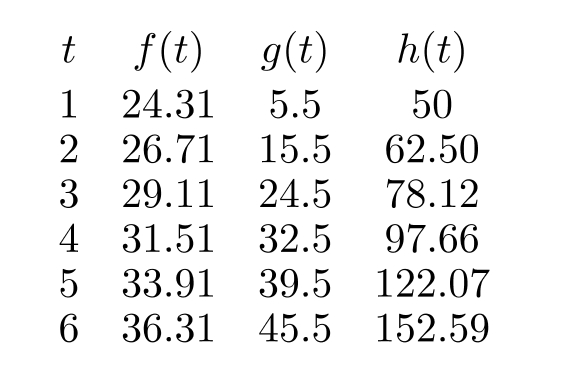
The formula for the exponential one is Round your second answer to 2 decimal places.
Correct Answer:

Verified
Part A: 40...View Answer
Unlock this answer now
Get Access to more Verified Answers free of charge
Correct Answer:
Verified
View Answer
Unlock this answer now
Get Access to more Verified Answers free of charge
Q70: Which of the graphs in the
Q71: The amount of pollution in a
Q72: A biologist measures the amount of
Q73: Is the function graphed exponential?<br> <img src="https://d2lvgg3v3hfg70.cloudfront.net/TBW1046/.jpg"
Q74: The following figure gives the graph
Q76: The US population in 2005 was
Q77: A biologist measures the amount of
Q78: What is <span class="ql-formula" data-value="\lim
Q79: An ant population grows at a
Q80: The price of an item increases