Short Answer
The figure below shows the graphs of the following functions:
(A)
(B)
(C)
(D)
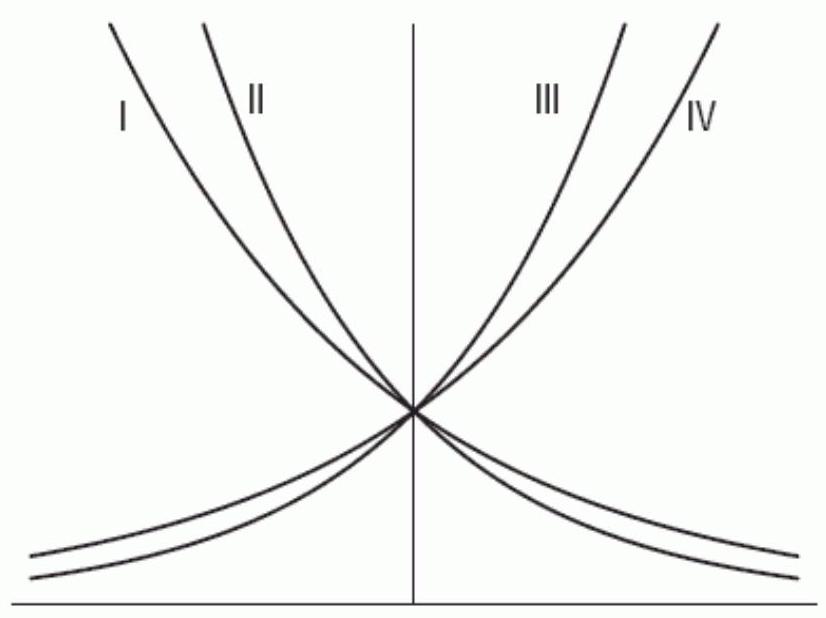
Which one is the graph of A?
Correct Answer:

Verified
Correct Answer:
Verified
Related Questions
Q84: You invest <span class="ql-formula" data-value="\$
Q85: Find <span class="ql-formula" data-value="\lim _{x
Q86: The graph of the exponential function
Q87: In the exponential formula <span
Q88: In some developing countries, the inflation
Q89: Let <span class="ql-formula" data-value="f(x)"><span class="katex"><span
Q90: The US population in 2005 was
Q91: What is the horizontal asymptote of
Q93: The formula for the exponential function
Q94: The price of an item increases