Multiple Choice
The graphs of and are shown below.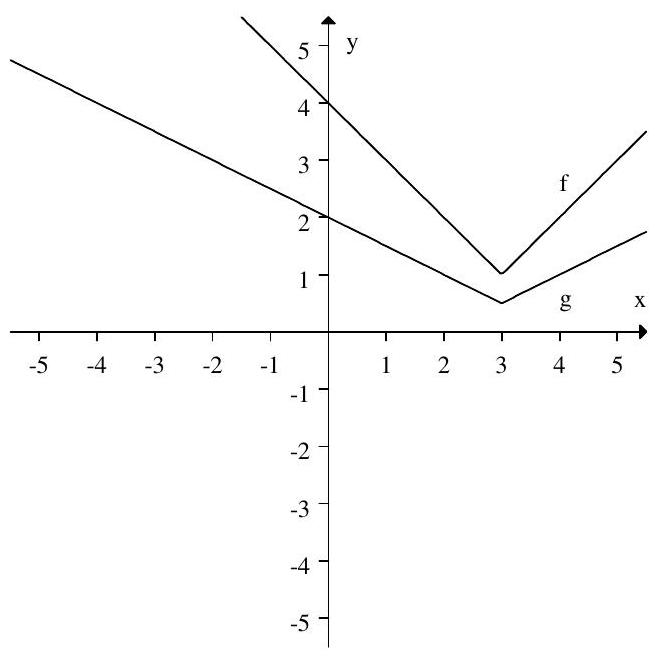
Which of the following gives a formula for in terms of ?
A)
B)
C)
D)
Correct Answer:

Verified
Correct Answer:
Verified
Related Questions
Q8: An odd function is increasing and concave
Q9: If the graph of the line
Q10: The domain of <span class="ql-formula"
Q11: The following table gives some values
Q12: The point <span class="ql-formula" data-value="(a,
Q14: Given the following table of values
Q15: The point <span class="ql-formula" data-value="(4,-2)"><span
Q16: The following table gives values for
Q17: Below is a graph of the
Q18: The first figure is the graph