Multiple Choice
The first figure is the graph of . Which of the other figures (a) -(f) show the graph of ?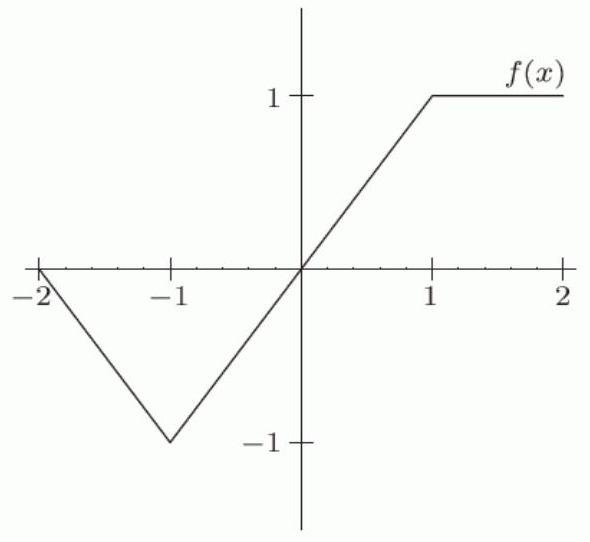
A) 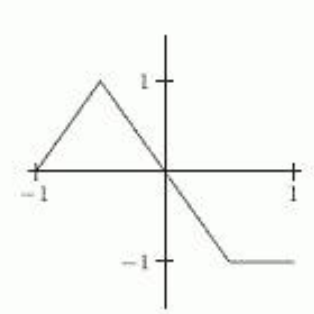
B) 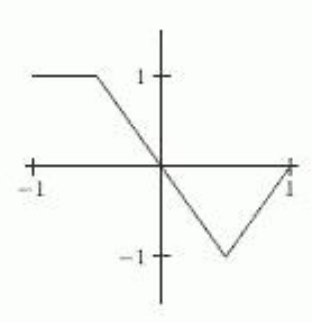
C) 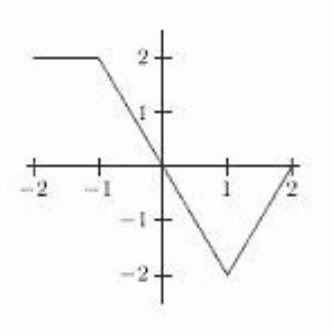
D) 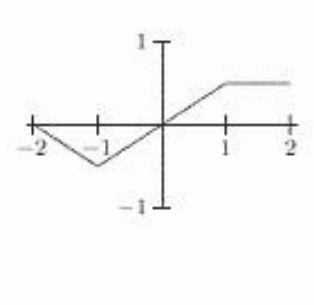
E) 
F) 
Correct Answer:

Verified
Correct Answer:
Verified
Related Questions
Q13: The graphs of <span class="ql-formula"
Q14: Given the following table of values
Q15: The point <span class="ql-formula" data-value="(4,-2)"><span
Q16: The following table gives values for
Q17: Below is a graph of the
Q19: If <span class="ql-formula" data-value="f(x)"><span class="katex"><span
Q20: If the graph of <span
Q21: The following is the graph of
Q22: The graph of <span class="ql-formula"
Q23: A cup of coffee is initially