Multiple Choice
Suppose that , and are integers and that is positive and even, is positive and odd, is negative and even, and is negative and odd. Which of the following graphs could correspond to the power function ? If none of the graphs correspond to the function, enter "none".
A) 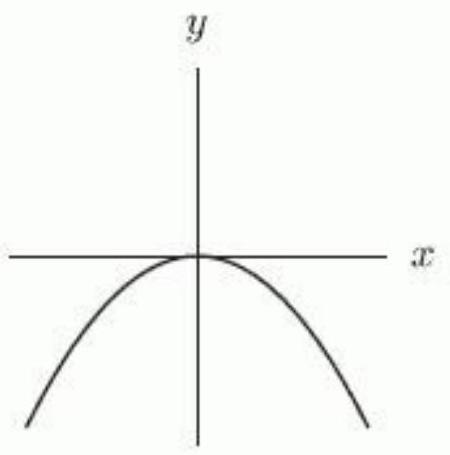
B) 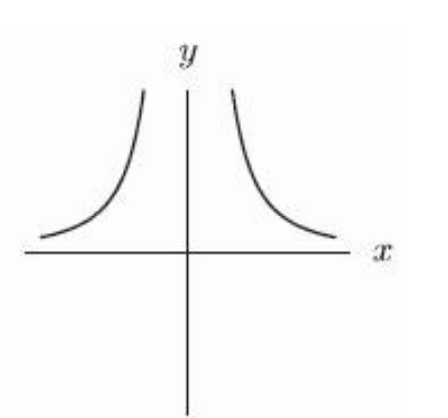
C) 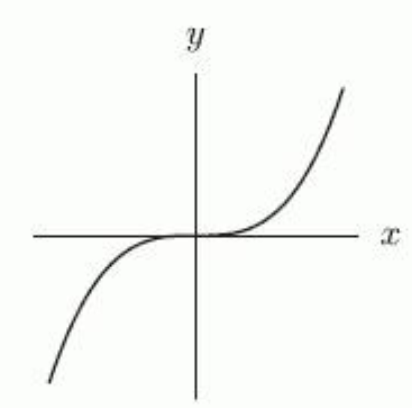
D) 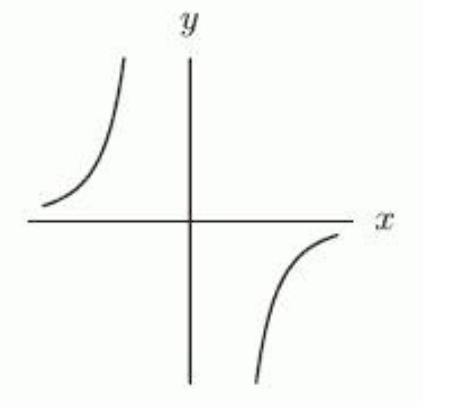
Correct Answer:

Verified
Correct Answer:
Verified
Q62: Suppose that <span class="ql-formula" data-value="f(x)=4
Q63: The following figure gives the graphs
Q64: Which of the following figures shows
Q65: The functions <span class="ql-formula" data-value="f"><span
Q66: The following table represents the amount
Q68: Let <span class="ql-formula" data-value="p(x)"><span class="katex"><span
Q69: Let <span class="ql-formula" data-value="f(x)=\frac{6}{x+8}"><span class="katex"><span
Q70: Compute the following limits:<br>a) <span
Q71: Which of the following statements are
Q72: Describe the graph of <span