Multiple Choice
The following table represents the amount of monthly data handled by MichNet, the University of Michigan's gateway to the Internet, sampled at six month intervals for the years 1993-1995. (The data is from the Michigan Daily, March 30, 1996, p.4.) 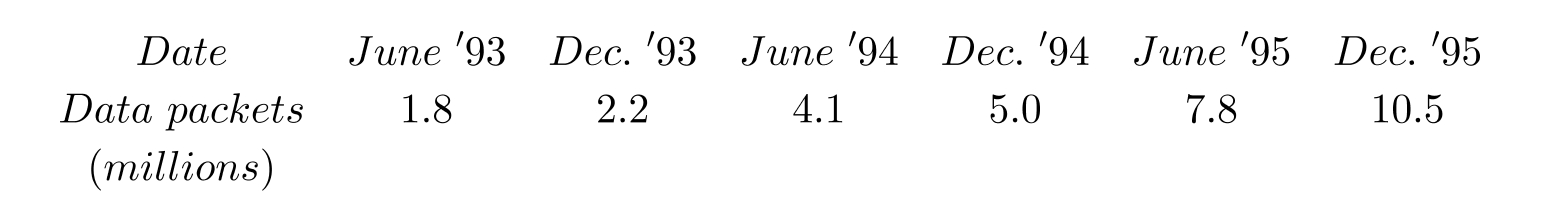
Let be the number of data packets handled monthly (in billions) , and be time in years since December, 1992. Find equations for the best fit exponential function and the best fit power function that model these data (you do not have to enter your equations) . By comparing their correlation coefficients, choose which model gives a better fit.
A) The exponential model
B) The power function model
Correct Answer:

Verified
Correct Answer:
Verified
Q61: Let <span class="ql-formula" data-value="f(x)=(x-2)^{2}(x+4)"><span class="katex"><span
Q62: Suppose that <span class="ql-formula" data-value="f(x)=4
Q63: The following figure gives the graphs
Q64: Which of the following figures shows
Q65: The functions <span class="ql-formula" data-value="f"><span
Q67: Suppose that <span class="ql-formula" data-value="a,
Q68: Let <span class="ql-formula" data-value="p(x)"><span class="katex"><span
Q69: Let <span class="ql-formula" data-value="f(x)=\frac{6}{x+8}"><span class="katex"><span
Q70: Compute the following limits:<br>a) <span
Q71: Which of the following statements are