Multiple Choice
Let . Which of the following is the graph of ?
A) 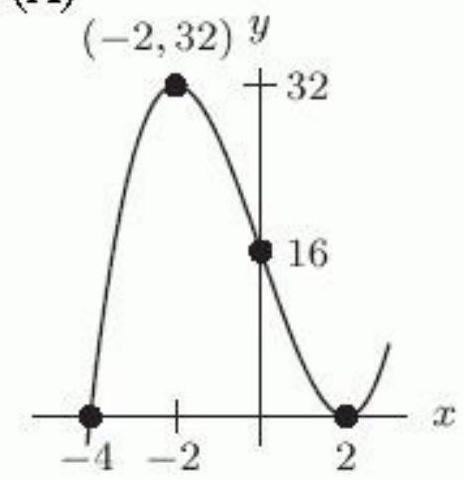
B) 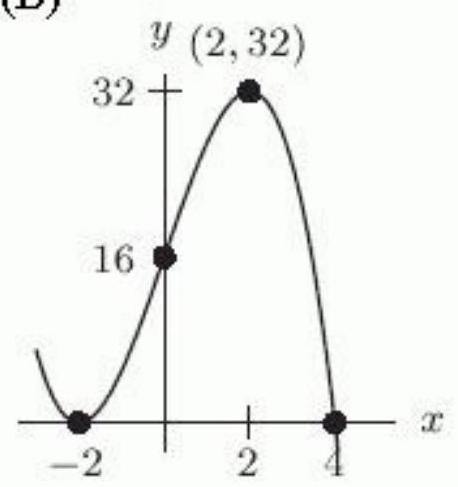
C) 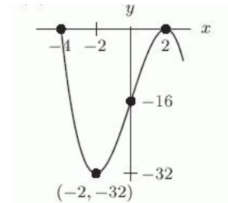
D) 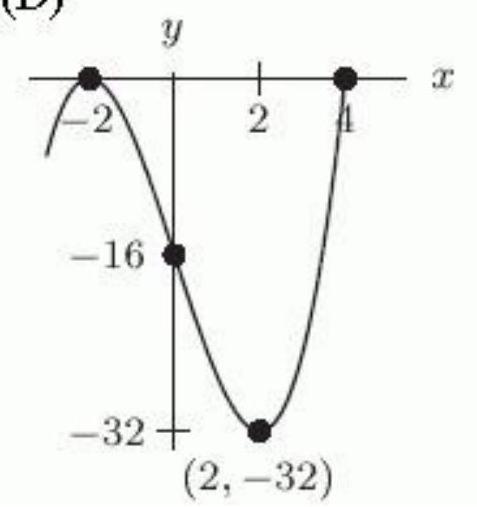
Correct Answer:

Verified
Correct Answer:
Verified
Related Questions
Q56: The following figure shows the graph
Q57: Which of the following statements describe
Q58: The following graphs are of functions
Q59: Can <span class="ql-formula" data-value="f(x)=\frac{2}{3 x^{4}}"><span
Q60: The following table represents the amount
Q62: Suppose that <span class="ql-formula" data-value="f(x)=4
Q63: The following figure gives the graphs
Q64: Which of the following figures shows
Q65: The functions <span class="ql-formula" data-value="f"><span
Q66: The following table represents the amount