Multiple Choice
Table 2.1 Age of Respondents
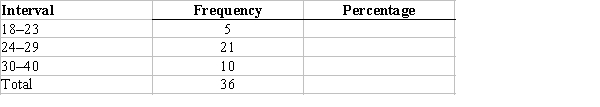
-According to Table 2.1, what is the width of each interval if 60 cases range in score from 4 to 84, and 10 intervals in a frequency distribution are wanted?
A) approximately 4
B) approximately 8
C) approximately 12
D) approximately 60
Correct Answer:

Verified
Correct Answer:
Verified
Q1: Which of the following should be reflected
Q3: Table 2.2 Number of Prior Convictions among
Q4: Table 2.2 Number of Prior Convictions among
Q5: A company has 8 entry-level workers and
Q6: The variable "number of fitness centres" across
Q7: A researcher presents a figure to depict
Q8: Table 2.2 Number of Prior Convictions among
Q9: Table 2.2 Number of Prior Convictions among
Q10: In June 2014, the entire province of
Q11: Why do researchers commonly use intervals when