Multiple Choice
Use the pictograph to answer the question.
-This pictograph shows projected sales of compact disks (CDs) for a popular rock band for seven consecutive years.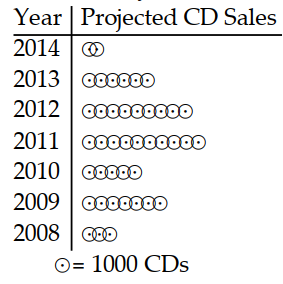
Between which two consecutive years is the greatest decline in sales indicated?
A) Between 2009 and 2010
B) Between 2013 and 2014
C) Between 2012 and 2013
D) Between 2010 and 2011
Correct Answer:

Verified
Correct Answer:
Verified
Q22: Use the pictograph to answer the
Q23: Use the circle graph to solve
Q24: Use the circle graph to solve
Q25: Refer to the double-bar graph below which
Q26: Find the mean.<br>- <span class="ql-formula" data-value="43,50,32,46,29,50,30"><span
Q28: Construct the indicated stem-and-leaf.<br>-The normal monthly
Q29: For the set of numbers, find
Q30: A dart is thrown randomly and
Q31: Construct the indicated stem-and-leaf.<br>-The weights of 22
Q32: Use the graph to answer the