Multiple Choice
Use the graph to answer the question.
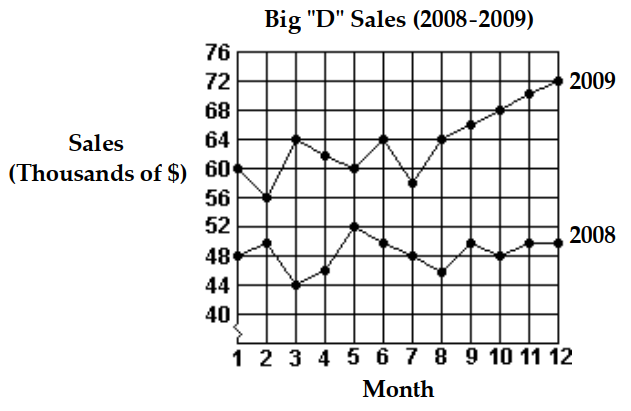
-What was the increase in sales between month 5 and month 6 of 2009?
A)
B)
C)
D)
Correct Answer:

Verified
Correct Answer:
Verified
Related Questions
Q27: Use the pictograph to answer the question.<br>-This
Q28: Construct the indicated stem-and-leaf.<br>-The normal monthly
Q29: For the set of numbers, find
Q30: A dart is thrown randomly and
Q31: Construct the indicated stem-and-leaf.<br>-The weights of 22
Q33: Construct a bar graph to represent the
Q34: A deck of cards contains 52
Q35: For the set of numbers, find
Q36: Solve the problem.<br>-Samuel consumed 2161 calories of
Q37: Solve the problem.<br>-Draw a tree diagram for