Multiple Choice
Refer to the double-bar graph below which shows the number of male and female athletes at a university over a four-year period. Solve the problem.
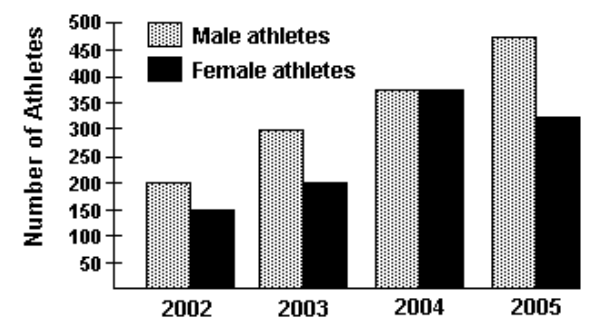
-What was the percent of increase in the number of male athletes from 2002 to 2003 ?
A)
B)
C)
D)
Correct Answer:

Verified
Correct Answer:
Verified
Related Questions
Q3: Solve the problem.<br>-An experiment is done to
Q4: Solve the problem.<br>-Bengisu was pregnant 271 days
Q5: Solve the problem.<br>-To get a C in
Q6: Refer to the double-bar graph below which
Q7: Solve the problem.<br>-An experiment is done to
Q9: The bar graph below shows the number
Q10: Make a line graph of the data
Q11: The following table contains information about
Q12: For the set of numbers, find
Q13: For the set of numbers, find the