Essay
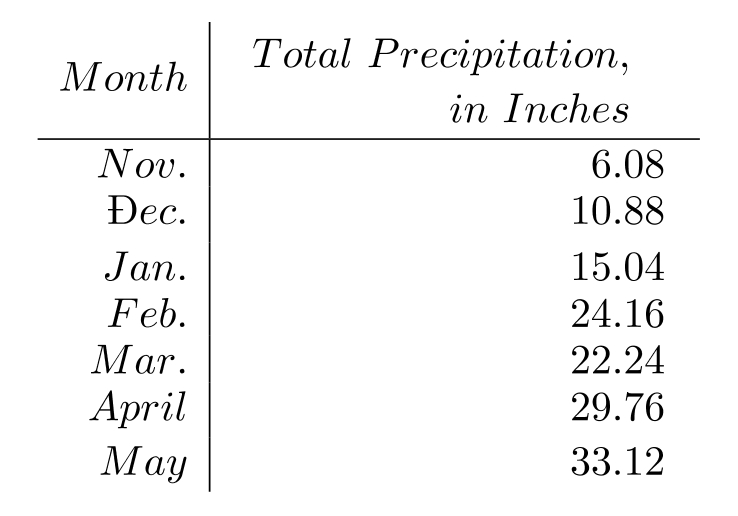
Make a line graph of the data in the table.
-The following table gives the total amount of precipitation during the given months. Use time on the horizontal scale for your line graph.
Correct Answer:

Verified
Answers ma...View Answer
Unlock this answer now
Get Access to more Verified Answers free of charge
Correct Answer:
Verified
Answers ma...
View Answer
Unlock this answer now
Get Access to more Verified Answers free of charge
Related Questions
Q5: Solve the problem.<br>-To get a C in
Q6: Refer to the double-bar graph below which
Q7: Solve the problem.<br>-An experiment is done to
Q8: Refer to the double-bar graph below
Q9: The bar graph below shows the number
Q11: The following table contains information about
Q12: For the set of numbers, find
Q13: For the set of numbers, find the
Q14: Find any modes that exist.<br>- <span
Q15: Find the probability of the event.<br>-If