Multiple Choice
Refer to the double-bar graph below which shows the number of male and female athletes at a university over a four-year period. Solve the problem.
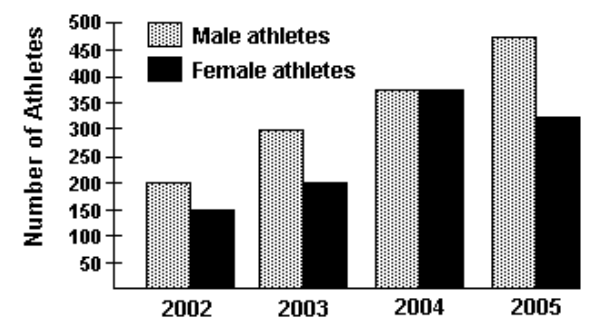
-Find the increase in the number of female athletes from 2003 to 2005.
A) 125
B) 225
C) 150
D) 175
Correct Answer:

Verified
Correct Answer:
Verified
Related Questions
Q88: Construct a frequency distribution for the
Q89: Given the grades of a student
Q90: Find any modes that exist.<br>-104, 141, 156,
Q91: Use the graph to answer the
Q92: Solve the problem.<br>-Patty experiments to see which
Q94: The histogram shows the scores of each
Q95: The bar graph below shows the number
Q96: Use the circle graph to solve the
Q97: Solve the problem.<br>-Juan experiments to see which
Q98: Use the two-way frequency table to