Multiple Choice
Use the graph to answer the question.
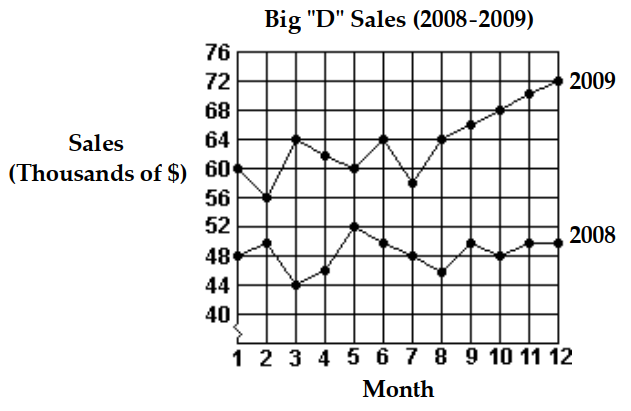
-What was the total increase in sales for the first 6 months from 2008 to 2009?
A)
B)
C)
D)
Correct Answer:

Verified
Correct Answer:
Verified
Related Questions
Q86: The bar graph below shows the number
Q87: Obtain the five-number summary for the
Q88: Construct a frequency distribution for the
Q89: Given the grades of a student
Q90: Find any modes that exist.<br>-104, 141, 156,
Q92: Solve the problem.<br>-Patty experiments to see which
Q93: Refer to the double-bar graph below which
Q94: The histogram shows the scores of each
Q95: The bar graph below shows the number
Q96: Use the circle graph to solve the