Multiple Choice
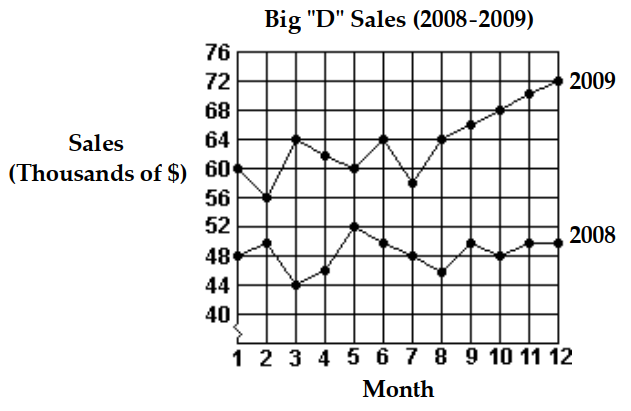
Use the graph to answer the question.

-What was the percent of increase in sales between month 2 and month 12 of 2009 ? Round your answer to the nearest tenth.
A)
B)
C)
D)
\section*{SHORT ANSWER. Write the word or phrase that best completes each statement or answers the question.}
Make a line graph of the data in the table.
Correct Answer:

Verified
Correct Answer:
Verified
Q123: Given the grades of a student
Q124: Construct a bar graph to represent the
Q125: Twenty teenagers were asked to give their
Q126: Find the median for the set
Q127: Find the probability of the event.<br>-If
Q129: Given the grades of a student
Q130: Make a line graph of the data
Q131: Find the median for the set
Q132: The following stem-and-leaf plot gives the
Q133: Use the pictograph to answer the question.<br>-This