Essay
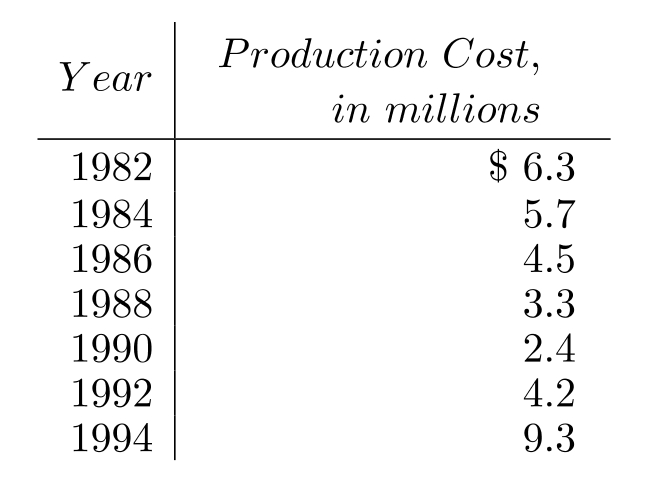
Make a line graph of the data in the table.
-The following table gives the average cost of producing a music video over the given years. Use time on the horizontal scale for your line graph.
Correct Answer:

Verified
Answers ma...View Answer
Unlock this answer now
Get Access to more Verified Answers free of charge
Correct Answer:
Verified
View Answer
Unlock this answer now
Get Access to more Verified Answers free of charge
Q125: Twenty teenagers were asked to give their
Q126: Find the median for the set
Q127: Find the probability of the event.<br>-If
Q128: Use the graph to answer the
Q129: Given the grades of a student
Q131: Find the median for the set
Q132: The following stem-and-leaf plot gives the
Q133: Use the pictograph to answer the question.<br>-This
Q134: The following table contains information about
Q135: Find the mean.<br>- <span class="ql-formula" data-value="39,47,27,43,24"><span