Essay
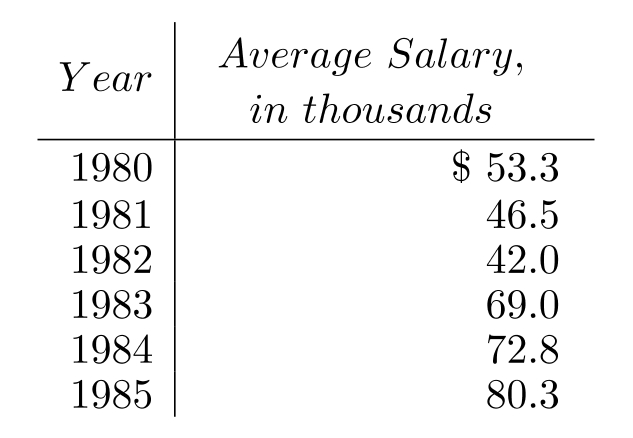
Make a line graph of the data in the table.
-The following table shows the median teacher's salary in District over several years. Use time on the horizontal scale for your line graph.
Correct Answer:

Verified
Answers may vary. Th...View Answer
Unlock this answer now
Get Access to more Verified Answers free of charge
Correct Answer:
Verified
Answers may vary. Th...
View Answer
Unlock this answer now
Get Access to more Verified Answers free of charge
Related Questions
Q104: The bar graph below shows the number
Q105: Find any modes that exist.<br>- <span
Q106: The following stem-and-leaf plot gives the
Q107: Use the two-way frequency table to
Q108: A dart is thrown randomly and
Q110: Find the mean.<br>-144, 168, 210, 108, 204,
Q111: Solve the problem.<br>-To get a B
Q112: Construct a bar graph to represent
Q113: Find the median for the set
Q114: Use the circle graph to solve