Multiple Choice
Use the two-way frequency table to solve the problem.
-A sample of 350 students was selected and each was asked the make of their automobile (foreign or domestic) and their year in college (freshman, sophomore, junior, or senior) . The results are shown in the table below.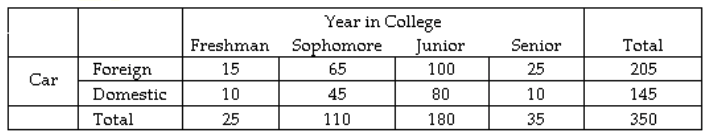
What percent of seniors drive a domestic automobile?
A)
B)
C)
D)
Correct Answer:

Verified
Correct Answer:
Verified
Q102: A dart is thrown randomly and
Q103: The following table contains information about moons
Q104: The bar graph below shows the number
Q105: Find any modes that exist.<br>- <span
Q106: The following stem-and-leaf plot gives the
Q108: A dart is thrown randomly and
Q109: Make a line graph of the
Q110: Find the mean.<br>-144, 168, 210, 108, 204,
Q111: Solve the problem.<br>-To get a B
Q112: Construct a bar graph to represent